• Skip to primary navigation
  • Skip to main content
NASA MAAP

NASA MAAP

Multimission Algorithm and Analytics Platform

  • About MAAP
  • News
  • Explore
    • MAAP Zenodo (Publications)
    • sciX Publication Search
    • Science
    • Events
  • Communities
    • GitHub Discussions
    • ESA MAAP Home
  • Help
    • Documentation (ReadTheDocs)
    • Terms of Service
    • Open Policies
    • Bug/Feature Reports (GitHub)
  • Login
    • Profile
  • Show Search
Hide Search

Publication

Circumpolar boreal biomass-density and vegetation-height is being transferred to the ORNL DAAC

May 6, 2025

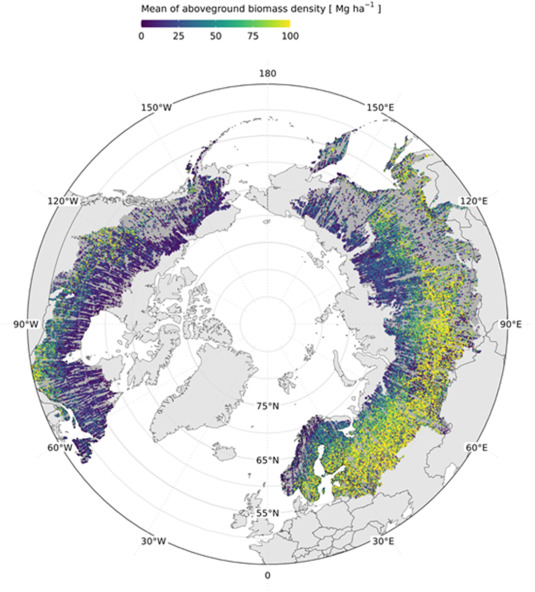
Circumpolar boreal aboveground biomass density (AGBD) and vegetation height (v2) is being transferred to the Oak Ridge National Laboratory DAAC.

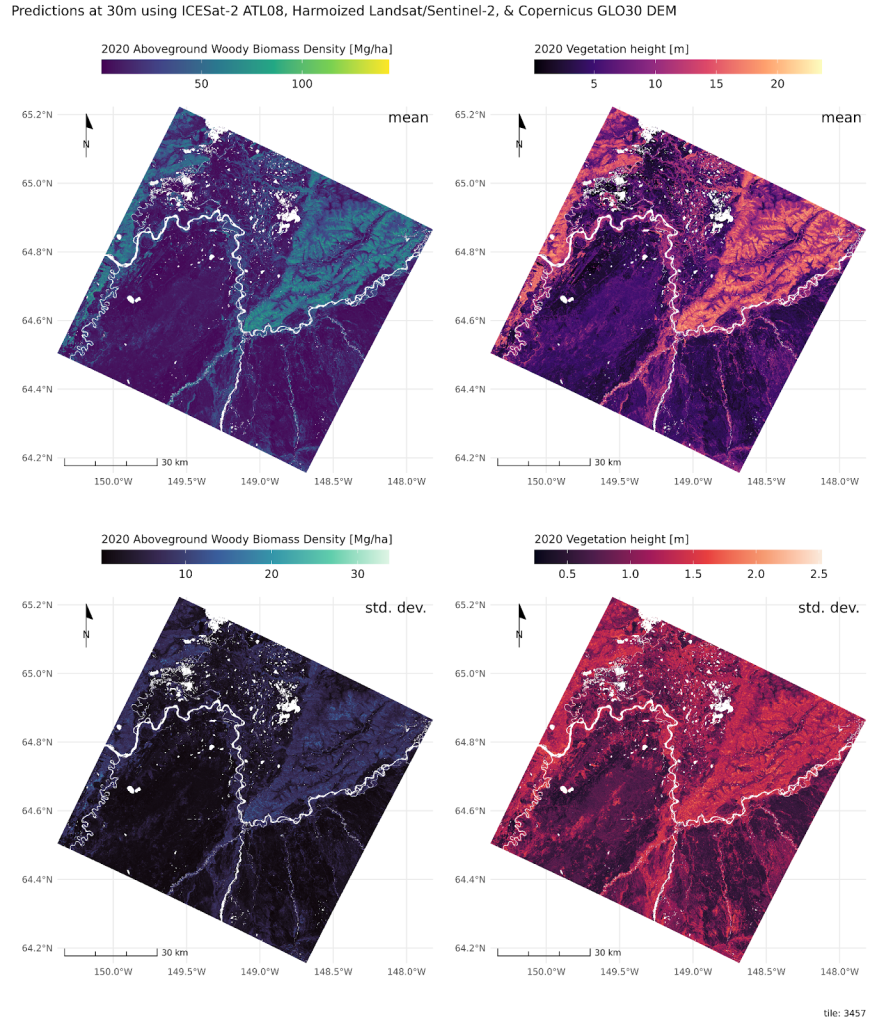
The map is built on MAAP with machine-learning models combining the 2020 archive of ICESat-2 height estimates with predictors from topography and Harmonized Landsat/Sentinel-2 surface reflectance.

The v2 dataset is available on the MAAP STAC. It features:

  • better representation of 0 heights (v6 ATL08); 
  • both Landsat and Sentinel-2 HLS inputs; 
  • neighborhood tile model enhancements; 
  • updated tile-level training data sampling; 
  • fixed topographic coviates data calculations;
  • post-processing masking bug-fix
  • no moss/lichen mask
  • refactored code base to improve run-time efficiency
A mapped example of the gridded data from a tile in Alaska.

This release completes the boreal component of a global carbon stock assessment derived from NASA space borne data.

Authors:
Paul Montesano | NASA Goddard Space Flight Center | ADNET Systems, Inc
Laura Duncanson | Dept. Geographical Science, U. Maryland College Park

Fire Events Data Suite (FEDS) Uses MAAP to Deploy Fire-Tracking Capabilities

April 30, 2025


The Fire Events Data Suite (FEDS) uses remotely-sensed fire hotspots to generate near-real-time estimates of fire behavior. FEDS provides fire perimeters, estimates of the active fire line, and mean radiative power for the fire. FEDS data helps scientists understand how fires evolve and spread through time. FEDS tracks fire in the continental United States and Canada. FEDS has been used to support NASA Disaster’s response to the Palisades fire, and featured in stories on the Park fire in CA, and the 2023 Canadian wildfire season. 

You can see FEDS fire perimeters on NASA’s Fire Information Resource Management System, or access the data through an API.

FEDS was developed by collaborators at University of California, Irvine, and the citation describing the algorithm is: 

Chen, Y., Hantson, S., Andela, N., Coffield, S. R., Graff, C. A., Morton, D. C., Ott, L. E., Foufoula-Georgiou, E., Smyth, P., Goulden, M. L., & Randerson, J. T. (2022). California wildfire spread derived using VIIRS satellite observations and an object-based tracking system. Scientific Data, 9(1), Article 1. 

https://doi.org/10.1038/s41597-022-01343-0

Towards global spaceborne lidar biomass: Developing and applying boreal forest biomass models for ICESat-2 laser altimetry data

July 16, 2024

Map visualization of mean aboveground biomass density

Space-based laser altimetry has revolutionized our capacity to characterize terrestrial ecosystems through the direct observation of vegetation structure and the terrain beneath it. Data from NASA’s ICESat-2 mission provide the first comprehensive look at canopy structure for boreal forests from space-based lidar. The objective of this research was to create ICESat-2 aboveground biomass density (AGBD) models for the global entirety of boreal forests at a 30 m spatial resolution and apply those models to ICESat-2 data from the 2019–2021 period. Although limited in dense canopy, ICESat-2 is the only space-based laser altimeter capable of mapping vegetation in northern latitudes. Along each ICESat-2 orbit track, ground and vegetation height is captured with additional modeling required to characterize biomass. By implementing a similar methodology of estimating AGBD as GEDI, ICESat-2 AGBD estimates can complement GEDI’s estimates for a full global accounting of aboveground carbon. Using a suite of field measurements with contemporaneous airborne lidar data over boreal forests, ICESat-2 photons were simulated over many field sites and the impact of two methods of computing relative height (RH) metrics on AGBD at a 30 m along-track spatial resolution were tested; with and without ground photons. AGBD models were developed specifically for ICESat-2 segments having land cover as either Evergreen Needleleaf or Deciduous Broadleaf Trees, whereas a generalized boreal-wide AGBD model was developed for ICESat-2 segments whose land cover was neither. Applying our AGBD models to a set of over 19 million ICESat-2 observations yielded a 30 m along-track AGBD product for the pan-boreal. The ability demonstrated herein to calculate ICESat-2 biomass estimates at a 30 m spatial resolution provides the scientific underpinning for a full, spatially explicit, global accounting of aboveground biomass.

Reference: https://www.sciencedirect.com/science/article/pii/S2666017224000348

Large-Scale Canopy Height Mapping Using C-band InSAR Coherence and GEDI LiDAR Data

December 19, 2023

Cartoon indicating the combination of GEDI and InSAR data

Dry forests and savannas have highly heterogeneous horizontal and vertical structure of woody vegetation and high temporal variability in moisture and phenology. This presents distinct challenges to SAR-based approaches to mapping canopy-height compared to tropical and temperate forests. Dense time-series of C-band (Sentinel-1A/1B) and, in future, L-band (NASA/ISRO NISAR) provide a pathway to reduce the impact of signal-noise and environmental conditions and to extract additional information more directly related to height, using repeat-pass Interferometric SAR (InSAR) techniques.  This work explores the potential information in Sentinel-1(S1) C-band InSAR temporal decorrelation and Global Ecosystem Dynamics Investigation (GEDI)-derived relative height metrics for canopy height estimation. The 12-day InSAR correlation (𝛾) and seasonal median were analyzed over a wide range of canopy heights and woody ecosystems, with a focus on dry forests and savannas in Australia, India, and South Africa as part of a NASA Carbon Monitoring System (CMS) investigation. To scale up the geographical extent, the algorithm was deployed on NASA’s Multi-Mission Algorithm and Analysis Platform (MAAP). To further enhance the computational efficiency, a tile-based approach is employed using the Military Grid Reference System. The canopy height maps were produced for  ~12.3 million km2  by processing nearly 1500 10x10 Sentinel-1 C-band Coherence tiles and approximately 130 million GEDI samples. In summary, this study provides new insights into the applicability and limitations of using InSAR data for canopy-height estimation in dry forest and savanna studies. Implementation of the proposed canopy-height estimation algorithm on the NASA-MAAP enables global scalability with current and future InSAR time series. The limitations with the C-band could be overcome partly, if not completely, with longer wavelengths like the L-band, such as those proposed for the upcoming NISAR, ALOS-3/PALSAR-4, and ROSE-L missions.

3x3 image comparing InSAR and GEDI and Canopy Height across India, Australia and South Africa

Figure 1. Maps of estimated canopy height for three countries using Sentinel-1 InSAR coherence and GEDI RH98. 


Test site

No. of1ᵒ x 1ᵒtiles

No. of GEDI samples x106
100m500m1000m
rRMSErRMSErRMSE
Australia91068.30.753.740.852.560.892.05
India40852.10.665.180.833.490.882.71
South Africa1659.20.443.350.562.380.592.02
Summary of accuracy metrics of canopy height estimations over the three test sites at various pixel sizes

Narayanarao Bhogapurapu1 Paul Siqueira1, John Armston2, Mikhail Urbazaev2,  Xiaoxuan Li3, Konrad Wessels3, Laura Duncanson2

1 University of Massachusetts Amherst,2 University of Maryland, 3 George Mason University

Related Publications: 

  • N. Bhogapurapu, P. Siqueira, J. Armston, Xiaoxuan Li, M. Urbazaev, K. Wessels, and L. Duncanson 2023 “Largescale forest stand height estimation using C-band InSAR correlation,” Geoscience and Remote Sensing Symposium(IGARSS), IEEE International.
  • N. Bhogapurapu, P. Siqueira, J. Armston, Xiaoxuan Li, M. Urbazaev, K. Wessels, and L. Duncanson 2023 “Large-scale Canopy Height Estimation using C-band InSAR Correlation,” PolInSAR 2023: 11th International Workshop on Science and Applications of SAR Polarimetry and Polarimetric Interferometry and BIOMASS Workshop
  • N. Bhogapurapu, P. Siqueira, J. Armston, Xiaoxuan Li, K. Wessels, L. Duncanson 2022 “Temporal analysis of C-band InSAR decorrelation for canopy height mapping over dry forests and tropical savannas “, AGU Fall Meeting 2022.

Advancing Data Fusion and Research Collaboration for Global Science Initiatives

December 18, 2023

Sujen Shah will present a poster highlighting several science applications of the MAAP Platform at AGU 2023.

In this presentation, we will delve into the remarkable ways in which various teams have embraced and integrated the MAAP platform, yielding significant achievements. One such success story is the SISTER SBG Pathfinder project, which has seamlessly incorporated the MAAP architecture into their own system by uniquely employing the MAAP for data bulk production in AWS. In doing so, the SISTER team employed the MAAP-style approach throughout the entire product life cycle – from algorithm development to processing workflows, monitoring, and delivery to the Distributed Active Archive Centers (DAACs). 

The Boreal Biomass team under the ABoVE funding has leveraged the MAAP platform to not just do algorithm development, but also scaling up global data-product generation. Furthermore, the work of the Boreal Biomass group has been propelled by the MAAP, culminating in the publication of the first-ever high resolution boreal-wide woody above-ground biomass density product to the ORNL DAAC.

In addition to these accomplishments, we will present how the Biomass group generated per-country summaries using the MAAP’s collaborative and scalable environment. Prior efforts have taken weeks of work but with the MAAP it can be done within a couple of hours.Will also showcase the EIS Fire team’s plans to use the MAAP to generate and deliver near-real-time fire perimeters in the Continental United States and in Canada, Greece and Italy. Unique to the EIS Fire team’s use of the MAAP is continually processing data in a forward “keep-up” basis. 

Join us to explore the transformative impact of the MAAP on global scientific research, data harmonization, and international collaboration, ushering in a new era of innovative and unified Earth observation initiatives.

The poster may be found here: https://agu23.ipostersessions.com/default.aspx?s=09-B8-A4-F6-0C-69-1B-38-37-54-2A-18-45-1F-8E-73&guestview=true

  • Page 1
  • Page 2
  • Go to Next Page »

NASA MAAP

MAAP is a collaboration between ESA and NASA

  • Privacy Policy
  • Accessibility
  • ESA MAAP